eAi7 Supply Chain Optimization Analysis
How to Cut Freight Costs
with Data-Driven Insights
Align volume and urgency, benchmark with historical data, and use optimization to reduce premium freight— without sacrificing service.
The contents of this analysis are made available for informational purposes only and should not be relied upon for any legal, business, or financial decisions. We do not guarantee, represent, or warrant the accuracy or reliability of any of the contents because they are based on current beliefs, expectations, and assumptions, about which there can be no assurance due to various anticipated and unanticipated events. This material has been prepared to the best of our knowledge and research; information may not reflect the most current regulatory or industry developments. Neither eai7 nor its advisors or affiliates shall be liable for any losses that arise in any way due to reliance on the contents contained in this report.
Impact at a glance
What optimization can unlock

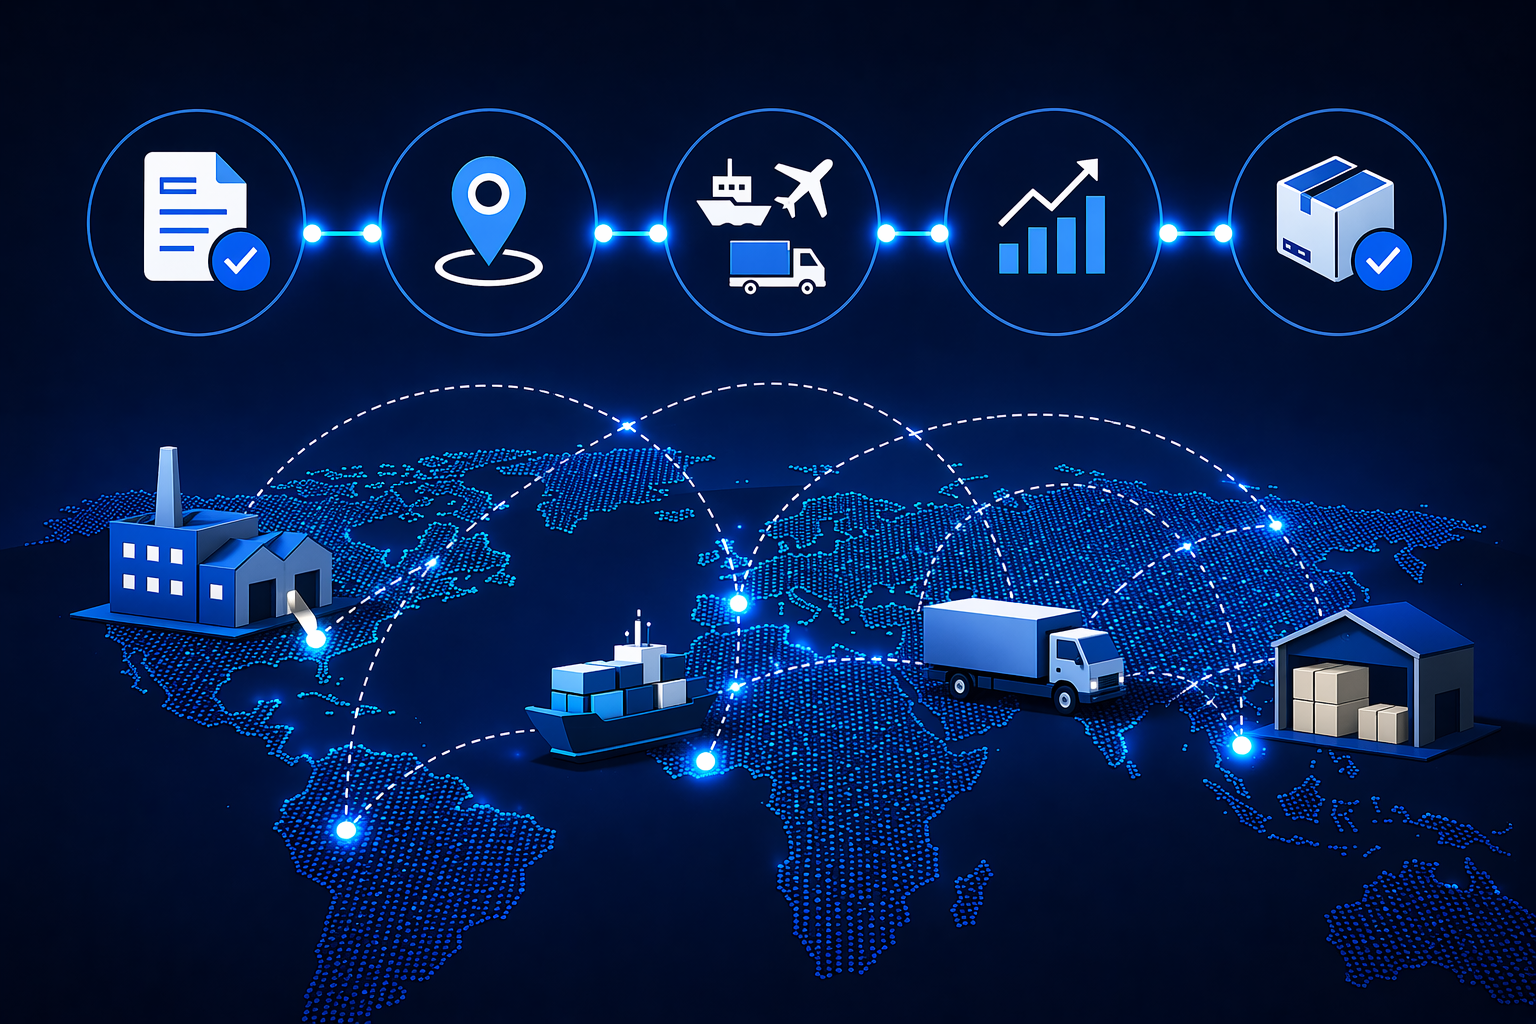
Global lanes
Data-driven mode choice across ocean, air, and inland legs.
Agenda
Seven-part playbook
Poll prompts from the session are shown as callouts—use them to stress-test your own planning assumptions.
What is Supply Chain Optimization?
Foundations & mode mix
The first step: benchmarking
Historical analysis & bespoke studies
Live data: automating savings
Algorithms vs. spreadsheets
In-app SCO demo
Setup, approval, execution
Measuring success: case studies
Field examples & savings
Coming up next
PO-level optimization
Key takeaways
Rhythm, network, procurement
Transport mix
Solutions across every leg

By sea→
FCL, LCL, and consolidation strategies for high-volume and deferred freight.

By air→
Premium vs deferred air, consolidations, and weight-break economics.

By road→
Dray, inland distribution, and first/final mile aligned to port and DC flows.
What is Supply Chain Optimization?
A supply chain is a network of organizations moving product from raw materials to consumers. Each node balances competing objectives—today we focus on mode selection and shipment allocation.
Poll
Do you feel that inefficient planning is costing you more than high freight rates?
Manufacture
What & how much do I make?
Decisions
- Demand profile: seasonal, viral, or steady?
- Model: push vs. pull strategy
Transport
How & when do I move goods?
Decisions
- Mode: air, ocean, rail, truck
- Service: premium vs. standard
Store
How much & where do I store?
Decisions
- Inventory position & strategy
- Target customer service level (CSL)
End-to-end
From PO to delivery—optimize before you book
Savings show up when purchase orders, supplier locations, and mode rules are modeled together—not when each lane is quoted in isolation.
Aligning volume and urgency
FCL
Single client, single vendor — high-volume cargo
Buyer’s Consolidation
Multiple local vendors → combined freight
LCL
Small, non-urgent volumes — cost-effective vs. air
Sea–air
Blend modes for cost + transit balance
Sea–air example — total transit ~27 days
Combining modes balances landed cost against time-to-market.
Where to begin? Benchmarking
Start with historical analysis: define goals and constraints, analyze shipment data, surface optimization opportunities, then actualize savings in planning and execution.
Poll
Have you conducted a historical analysis of your shipments to identify savings opportunities?
Identify company goals & constraints
Analyze historical data
Find optimization opportunities
Actualize savings
We optimize across:

Benchmarking turns history into leverage
Compare baseline vs optimized scenarios on real shipment files—then operationalize the wins.
| Optimization | Total air shipments | Avg weight (kg) | Air origin bill |
|---|---|---|---|
| Base strategy | 1,433 | 140 | $360K |
| Optimized | 1,097 | 182 | $284K |
| Delta | −336 (−23%) | +43 (+30%) | −$76K (−21%) |
Origin consolidation + BC
Illustrative: ~$170K air vs. ~$71K premium LCL; after origin consolidation, BC moves as FCL—often saving up to ~15% on transportation.
Freight + omni network design
Case comparison (illustrative)
Scenario 1
$5,278,637
$14.86 / carton
Scenario 2
$3,360,194
$9.46 / carton
VN, LK → Los Angeles → Fairfield / Dallas (example lane set)
Live data: automating savings detection
Poll
Are you currently using spreadsheets for your shipment planning?
Planning today is often heuristics across spreadsheets and multiple quotes. Supply Chain Optimization uses algorithms to cut logistics cost while meeting transit targets—baseline vs. recommended scenarios side by side.
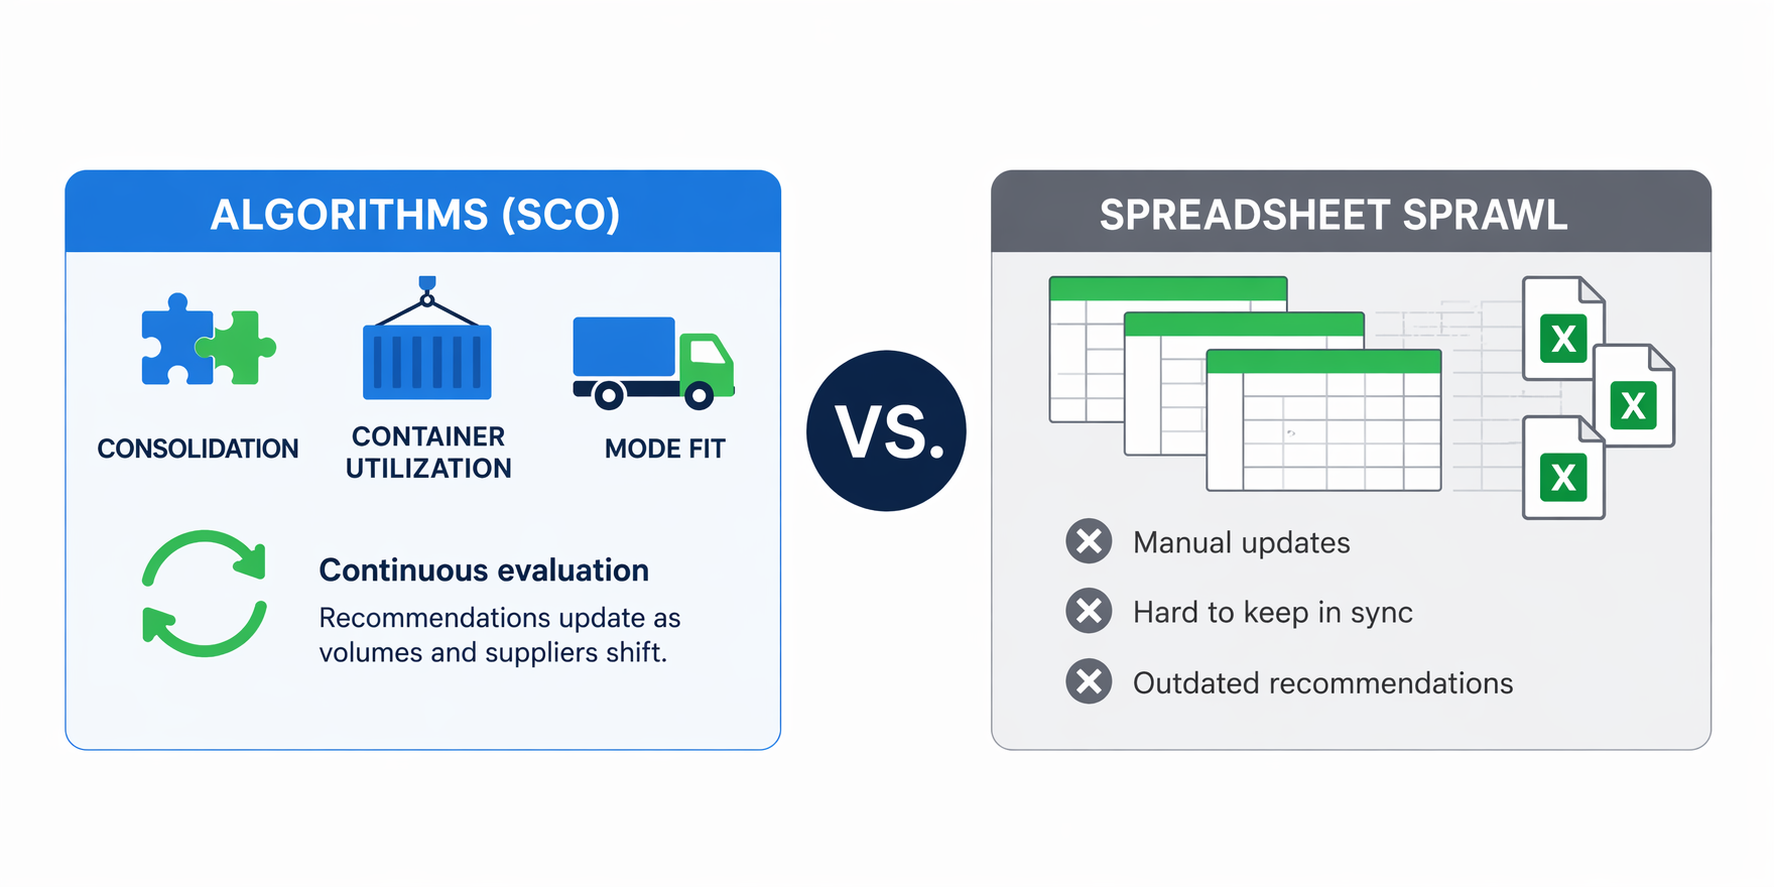
Algorithms vs. spreadsheet sprawl
SCO evaluates consolidation, container utilization, and mode fit continuously—so recommendations update when volumes and suppliers shift.
Baseline scenario
3 containers
Avg utilization ~78% · Costs ~$9,000
Recommended (SCO)
2 containers
Avg utilization ~86% · Costs ~$6,300
Illustrative consolidation outcome
In-app SCO workflow
Configure
Set SCO & BC parameters for your operations
Review
Data-backed view; one-click consolidation approval
Decide
Approve, reject, or omit shipments—see cost & utilization shift
Execute
Email notifications; analytics panels for savings tracking
Measuring success in the field
Do these challenges resonate? Manual replanning, siloed goals, operational complexity blocking coordination.
Up to ~15%
Adding Buyer’s Consolidation into the mode mix
Avg. ~50%
Underutilized FCLs improved via consolidation + BC (example cohort)
Up to ~30%
Air spend reduced via consolidations & weight breaks / HAWB leverage
Coming up next
Moving upstream to purchase-order-level optimization and more air opportunities.
Illustrative flex-ID merge
Consolidating shipments under one master flex ID can reduce per-kg and HAWB line items—compare totals before and after in your own data.
3 flex IDs (example)
$4,657.19
1 master flex ID
$3,632.26
Key takeaways
Continuous improvement rhythm
- ·Quarterly health checks: shift from annual reviews to 90-day audits.
- ·Refresh your baseline so optimized savings become the new standard.
Anticipate network shifts
- ·Start network design studies ~12 months before major DC moves.
- ·Use modeled per-carton costs to negotiate future logistics contracts.
Integrate procurement & logistics
- ·Optimize at the source: align PO sizing before booking.
- ·Double win: lower cost and carbon by shifting modes and maximizing load factor.
Thank you
For slides, diagrams, and the full narrative, download the PDF. Questions welcome—talk to eai7 about a benchmark on your lanes.